An iOS audio recorder in 4 lines of code


Starting from Creo 2.0.4 a new AudioRecorder class has been available. With this class developing an audio recorder is extremely simple.
We’ll start this tutorial by adding an AudioRecorder class to the main DesignBoard (an AudioRecorder1 instance will be automatically created) and then three buttons that we’ll use to start/stop recording and to play recorded audio:
Buttons have been properly aligned using a simple autoresizing mask, for more advanced alignment/positioning, Flex is the recommended way.
Code for the three buttons is very simple, we first check if the AudioRecorder1 is recording and then we start/stop or play the resulting audio file.
Gravity code for the buttons (to be written in their Action events) looks like:
While audio is recorded, data is written in a file, you can get the file location using the filePath property. A Sound class is needed to play audio from a file.
With 4 lines of code we created an audio recorderand with 4 more lines we are now able to play it. That would be more than enough for a basic recording app but our app would be much cooler if we could display a visual representation of the recording voice while it is running.
There are several ways to properly display audio data but I’d like to reuse what Creo offers and so we’ll use a simple bar chart. In order to visualize chart data we need a way to convert audio data to simpler floating point values.
In Creo most UI objects (like TableView, CollectionView, Chart and so on) require a DataSet to display data. Think about a DataSet as a collection of values and Creo already comes with a lot of common and ready to use DataSet like Databases (MySQL, PostgreSQL, SQLite and cubeSQL), REST API, XML, JSON, and many others.
Users can also create their own DataSet and that’s exactly what we are going to do in this tutorial. We’ll create a DataSet using the data from the audio recording and we’ll connect that DataSet to the Chart control to give the user visual feedback of his audio recording.
Before creating a DataSet we need to gather data from the AudioRecording class. According to the official documentation, we need to explicitly call the updateMeters method and then we can read the averagePower value.
The best way to execute a method at a regular interval is by using a Timer. A Timer is an object that can schedule the execution of some code on a regular basis. To create a Timer, simply drop a Timer object from the controls list. Set its interval to 0.10 seconds and check the Repeat checkbox (that means to execute the Timer1 Action event 10 times a second until app quits or Timer1.stop() is explicitly called).
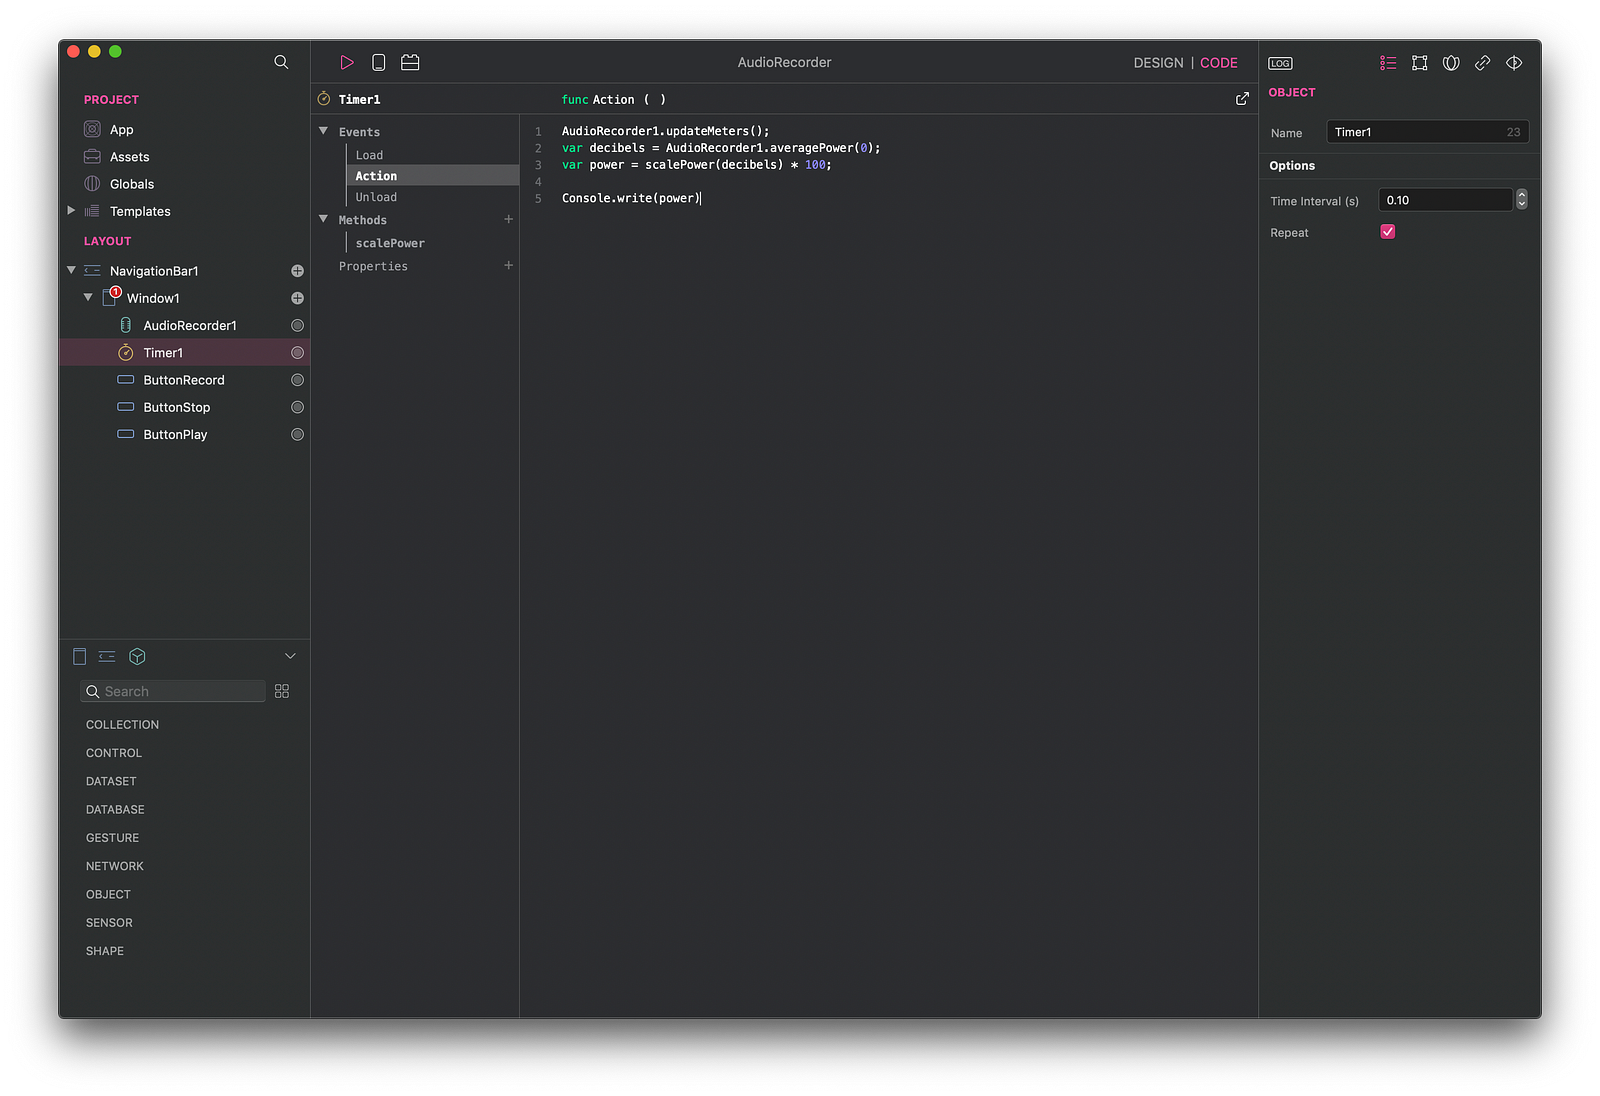
Timer1 Action event looks like:
The averagePower method returns the average power, in decibels, for the sound being recorded. A value of 0 means maximum power, while a value of -160 dB indicates minimum power (or near silence).
We need the help of a helper function in order to get normalized values (values from 0.0 to 1.0). That’s the reason why we added a scalePower(power) method to the Timer1 instance:
At this point, if you press Run in the simulator and then press the Record button you would expect Log Console window to be filled with power values but nothing happens. So what is missed?
It turns out that Timer1 needs to be explicitly started with a Timer1.start() call and so our buttons code need to be updated:
If you press Run and then Record you’ll see a lot of values in the Log Console panel.
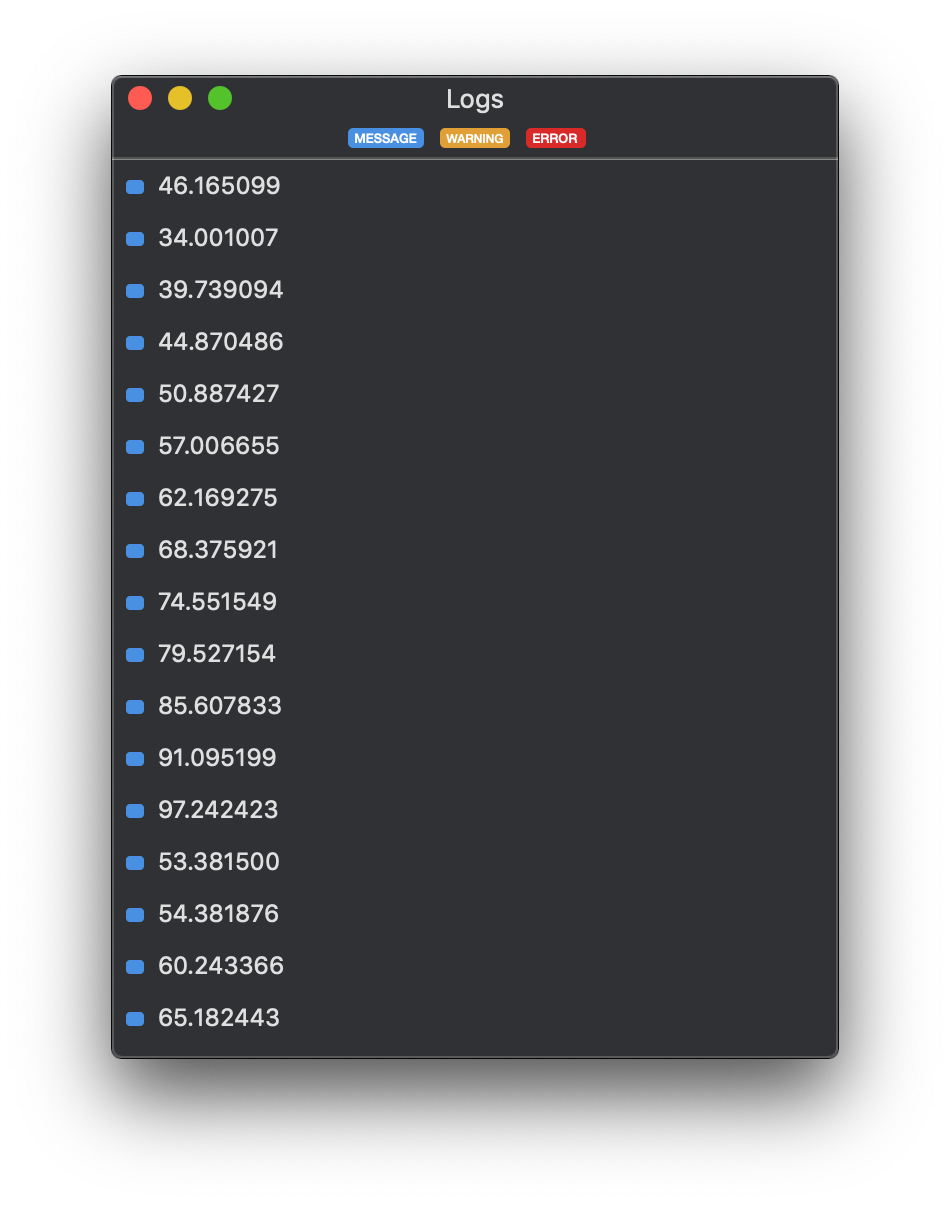
We now have a normalized stream of values (from 0 to 100) that we want to visualize in a Chart control. So, let’s start by creating a DataSet that can later be used by our Chart.
Drop a DataSet object from the controls list into Window1 and rename it to a more descriptive AudioDataSet. Setting up a custom DataSet in pretty simple and requires three events to be filled:
- Rows (this event should return the number of available rows in our DataSet)
- Columns (this event should return the number of available columns in our DataSet)
- Value (row, column) (this event should return the real value based on the row/column parameters)
To keep our code as simple as possible our DataSet will be array based and we’ll define the maximum size of our array, once that size is exceeded then we’ll start reusing the array starting from the beginning (we do not need a historical data for our Chart, we just need to display current values).
With all these requirements we can start by adding three properties to our AudioDataSet object:
- r = [] (this is our array)
- maxSize = 10 (this is the maximum size of r, this value should be computed at runtime (device frame width / bar item width)
- i = 0 (index of the next value to be written to the r array)
We need also to add a helper function to add values to our r array. Our addValue(v) method looks like:
The final AudioDataSet will looks like:
In the Load event the array r is initialized with 0.0 values. The Rows event simply return the size of the array. The Columns event returns 1 because we do not need more columns and finally, the Value event simply returns the value of the row index inside our r array.
It is now time to start working on the Chart so let’s drop a Chart control to the Design Board.
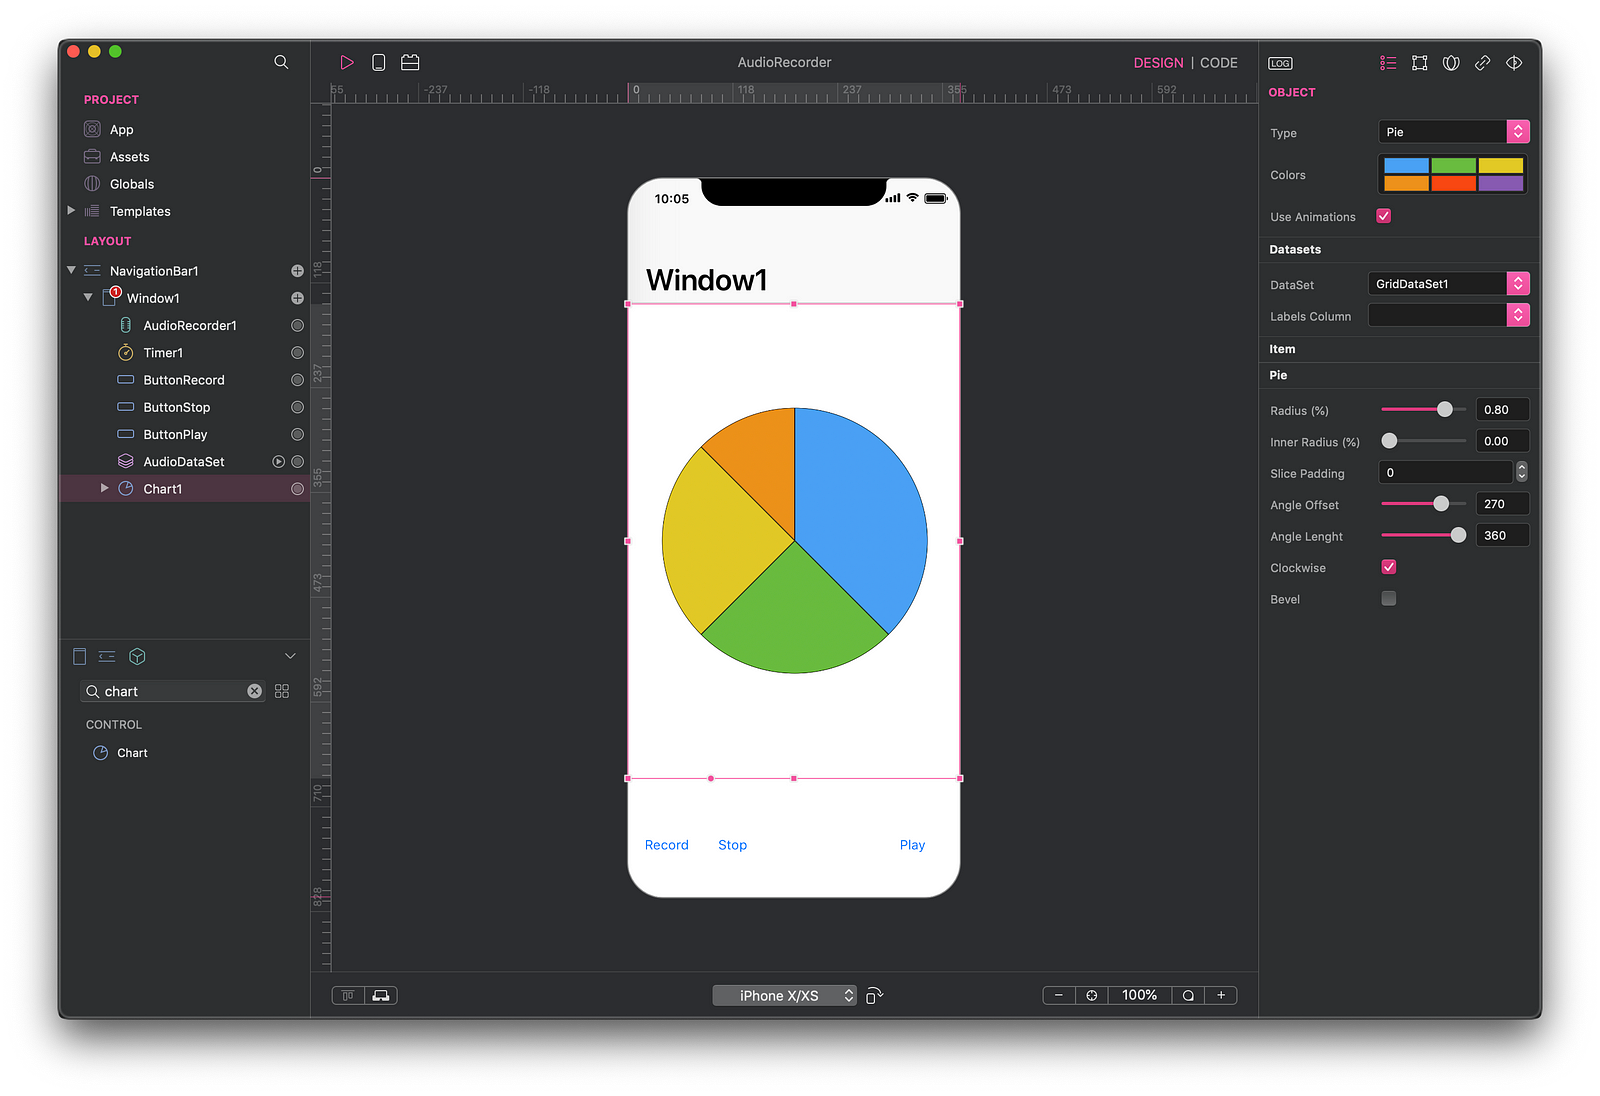
Chart1 needs to be properly configured and I’ll leave the description of all the details inside the project file. Just a few notes here:
- The DataSet must be configured to AudioDataSet
- The Chart Type must be set to Bar and Use Animation checkbox must be unselected (we’ll update this chart 10 times per second and animation would be a bottleneck in this case)
- Auto Ranges must be disabled
We now have all the objects needed in our app. Only one final step is missed, in the Timer1 Action event we need to add computed value to the AudioDataSet and then reload Chart1. Timer1 Action event will look like:
Final app looks like:
A can download Creo project from our GitHub repo: https://github.com/creoapp/examples/raw/master/AudioRecorder.zip